Greek P&L Attribution
Option Anatomy splits every position's profit and loss into the forces that produced it: Delta, Gamma, Theta, Vega and the second-order effects. It's the same end-of-day attribution discipline institutional derivatives desks run on their own books, wired straight to your brokerage account.
One number in. Four forces out.
A daily P&L number is a sum, and sums hide their parts. A quiet +$12.00 day can be time decay earning $85.00 while a volatility move takes back most of it, or two enormous exposures cancelling by luck. The number is identical; the risk is not.
Attribution makes the parts visible. Each day, every position's P&L is decomposed into the contribution from the underlying's move (Delta), from the curvature of that move (Gamma), from the passage of time (Theta) and from the change in implied volatility (Vega), so you can see whether a trade made money for the reason you put it on.
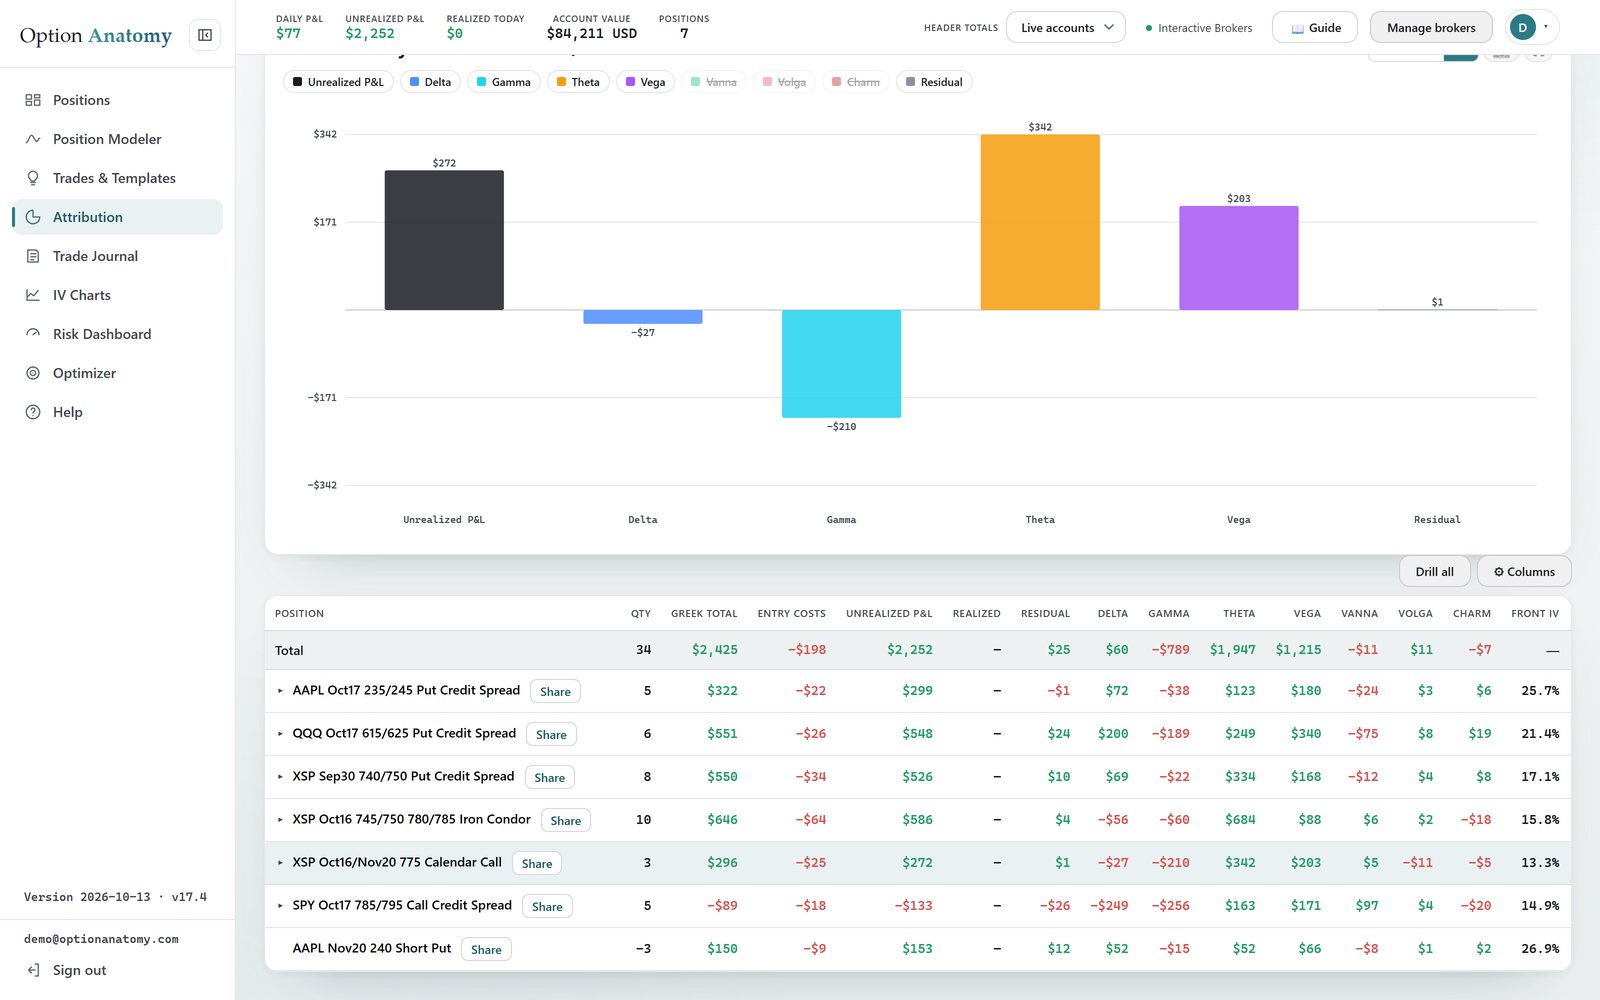
Figure: One reported number, four drivers: a +$412.00 day earned by Delta while the volatility leg quietly bled. Only attribution tells you which anatomy you have.
Two lenses. One honest answer.
Effects Breakdown shows how price, volatility and time contributed to your P&L. Greeks Breakdown shows contributions by Greek, with detail for each leg. Switch between them to explore the same positions.
Whatever the buckets don't explain is printed as a residual, never smeared into the greeks to make the table look clean. When a group's per-leg greek read is statistically unreliable (a deep in-the-money leg, gross exposure far above net), the app flags it and points you to the more robust basis. An attribution you can't trust is worse than none.
The desk playbook, on your book.
Serious trading desks attribute every book, every close, because it is how they know whether a strategy monetizes the driver it was designed to monetize. That discipline has simply never been available to individual traders: brokers report the net, and standalone tools never see your fills.
Option Anatomy closes that gap. Positions arrive from your broker and group themselves into strategies. Alongside each group's attribution you get the vega-weighted front implied volatility, the realized volatility of the underlying over a maturity-matched window, and their ratio, the richness read desks glance at before touching a position. Everything exports to CSV.
One day is a diagnosis. A month is a verdict.
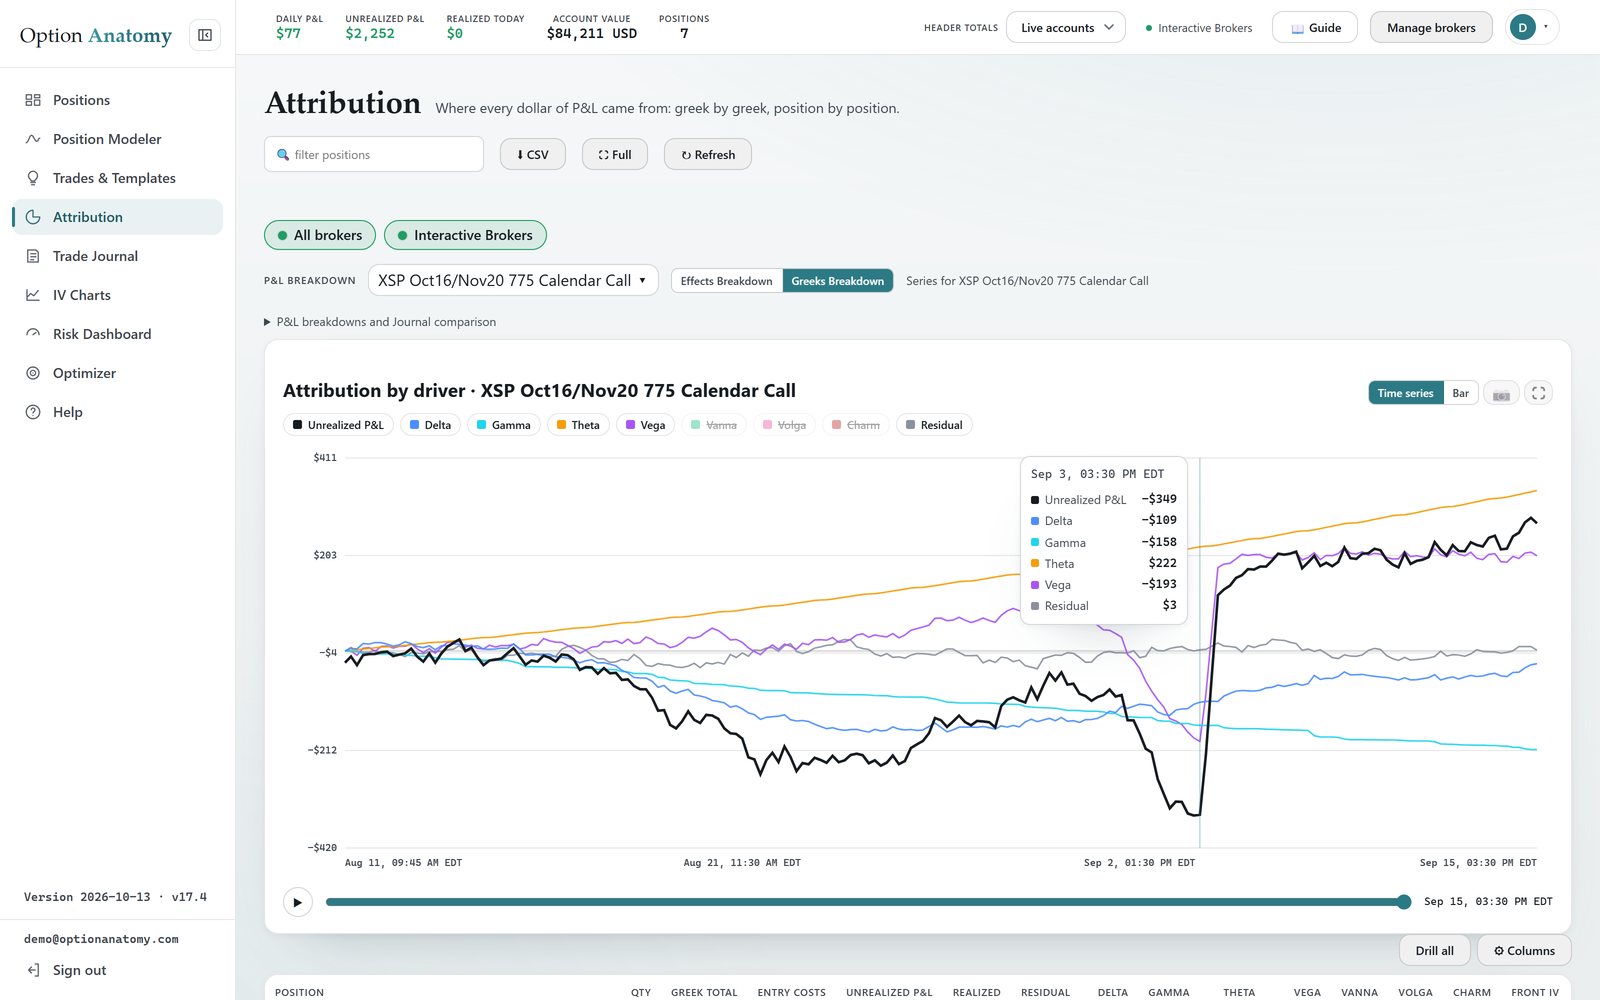
Click any strategy and its attribution unrolls as a cumulative time series, one driver at a time, over the position's captured history. Watch Theta accrue in a steady staircase while Vega saws around it, or discover that most of a "premium selling" profit actually came from a falling-volatility tailwind that a rising regime will take back.
Grouped attribution over weeks is how you find out what your approach actually monetizes, and it is exactly the evidence a raw equity curve can never give you.
Figure: A day decomposed: Delta +$289.00, Gamma −$52.00, Theta +$85.00, Vega −$310.00, netting to the +$12.00 the broker reported.
Do I have to log anything for attribution to work?
No. Your positions come straight from your connected brokerage, snapshots are captured automatically during market hours, and the attribution recomputes continuously. There is nothing to type and nothing to remember to do.
What is the difference between the two attribution bases?
Effects Breakdown highlights price, volatility and time effects. Greeks Breakdown shows contributions by Greek, with detail for each leg. Both include the P&L left unexplained as Residual.
What if the buckets don't sum to my actual P&L?
The difference is shown explicitly, as the Residual column in both views, rather than hidden inside a bucket. A small residual means you understand the position. A persistently large one usually points at volatility marks, and the app flags groups where the per-leg read is unreliable so you know which basis to trust.