Options Trade Journal
Every closed trade, reconstructed from your real fills across entries, exits, adjustments and commissions, named by strategy and graded by the force that actually paid you.
Reconstructed from fills. Not from memory.
Most trade journals fail for one reason: they depend on you filling them in. Option Anatomy builds yours from the executions your broker actually reported. Legs are grouped into the strategies they formed, an iron condor, a calendar or a vertical, with entry, exit, duration and days-to-expiry at entry recorded from the fills themselves.
Commissions are first-class citizens: carried per trade, summed in the totals, and shown beside realized P&L, so the net you see is the net you kept, not the gross you remember.
Partial closes and re-entries, handled.
Real trading is messy: you scale out of half, adjust a wing, close and re-enter the same strikes a week later. The journal reconstructs each of these as its own episode instead of blurring everything into one averaged position: a partial close books its realized result when it happens, and a re-entry starts a new record rather than contaminating the old one.
Drill in whenever the summary isn't enough. The Trades view expands every strategy into its individual legs, each with its own realized P&L and commissions, and the Activity feed shows the raw execution stream: every buy and sell, timestamped, filterable and exportable.
Graded by greek.
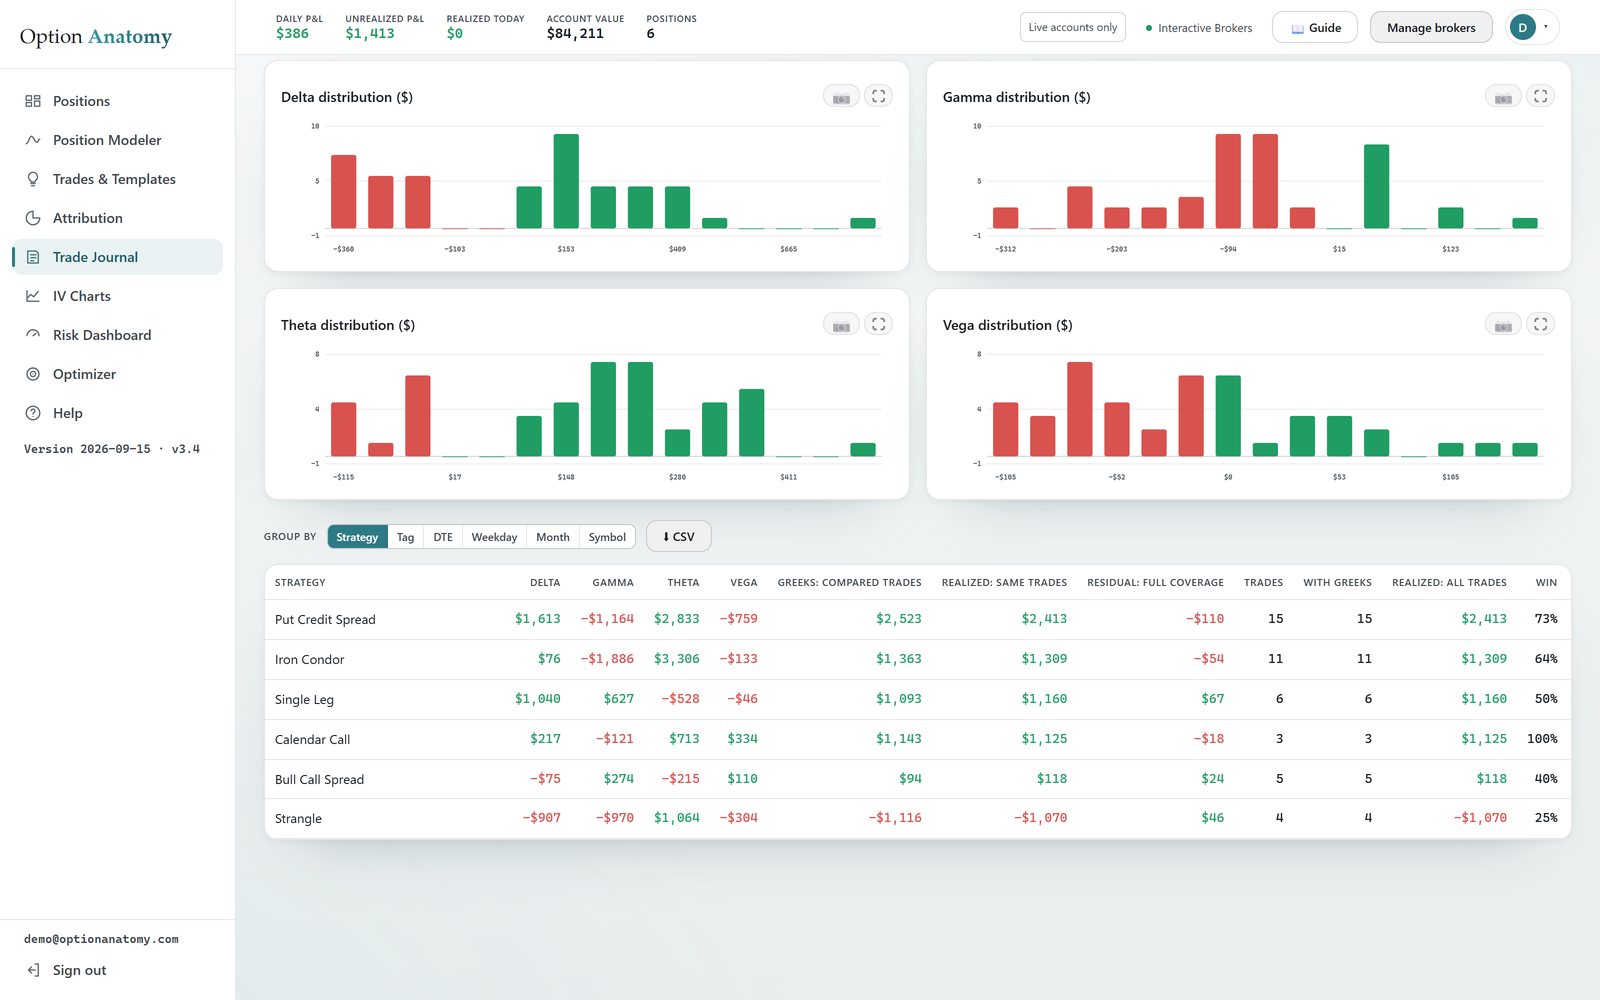
This is the part no other journal has: every closed trade carries its P&L attribution, showing how much of the result came from Delta, from Gamma, from Theta and from Vega, held over the life of the trade. Selling premium and consistently losing more to Gamma than you collect in Theta is a strategy problem; the journal is where that pattern becomes undeniable.
Aggregate the greek columns by strategy, days-to-expiry bucket, weekday, month or symbol, and the journal turns into a verdict on your whole approach, with entry and exit implied volatility recorded on every trade for context.
Figure: A closed trade decomposed by driver. Summed across a month of trading, these columns tell you what your strategy actually monetizes.
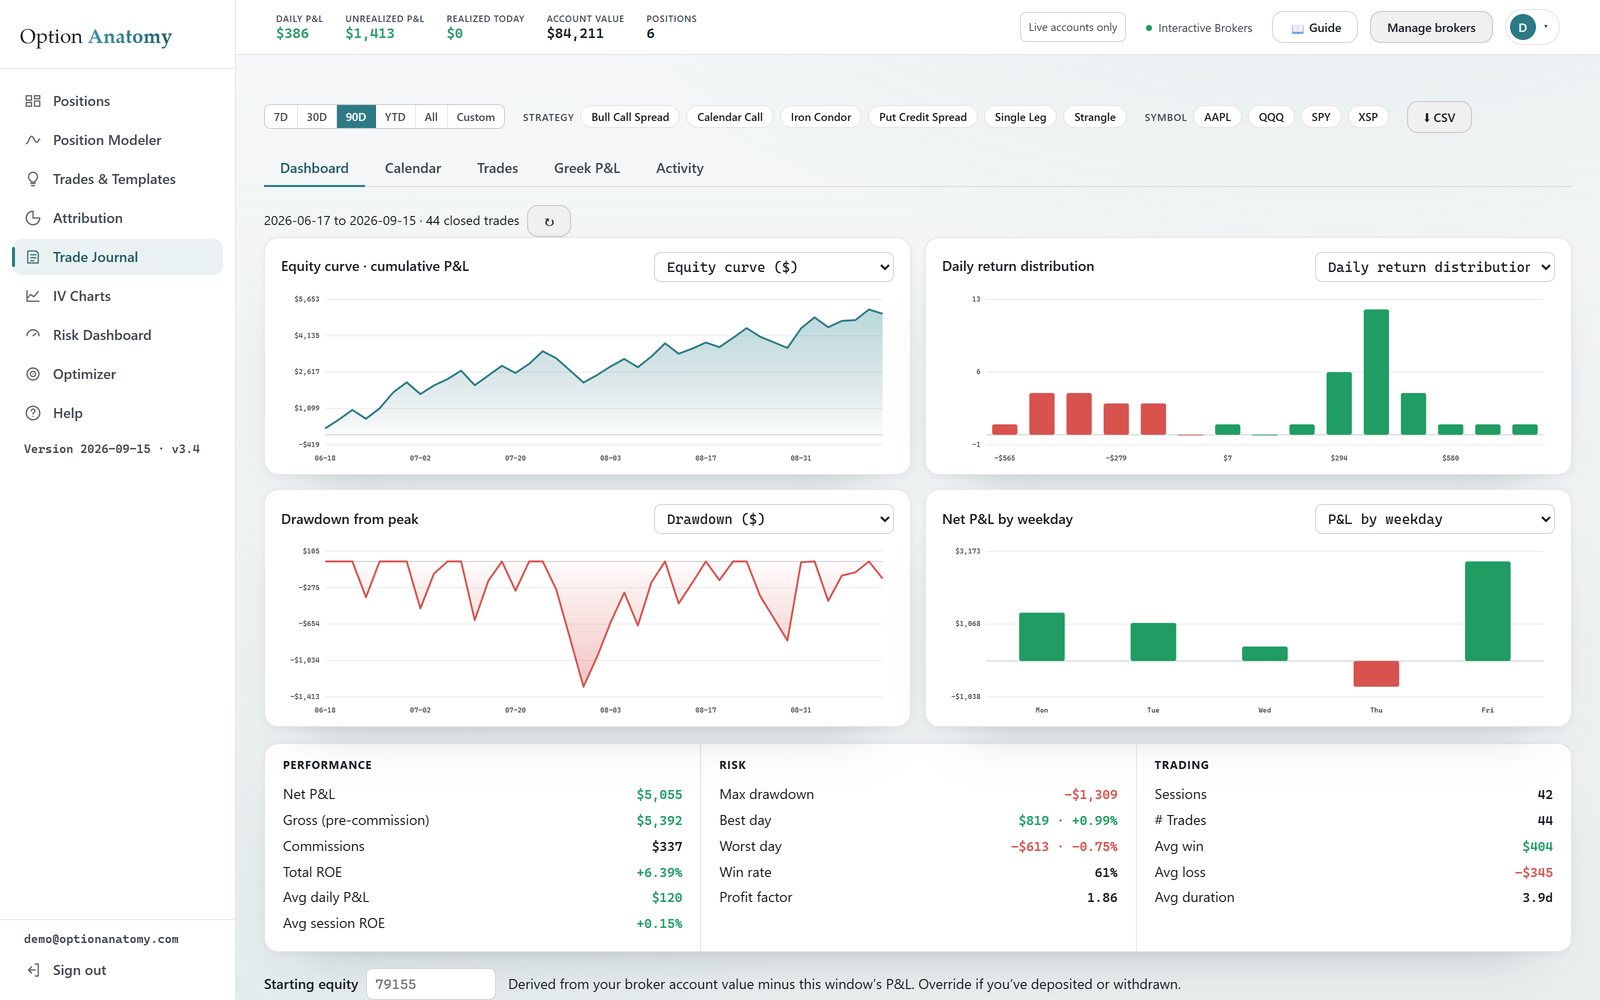
The numbers a trading record should show.
The dashboard computes the statistics that matter from your filtered set: net and realized P&L, win rate, profit factor, average win, average loss and average duration, beside an equity curve with drawdown, daily realized P&L, weekday and days-to-expiry breakdowns and a P&L distribution histogram.
Filter by date range, strategy or symbol; search the grid; sort any column; export everything to CSV. Your record, your data.
Figure: Theta does not arrive evenly, which is why average duration and days-to-expiry at entry are worth recording: they say which part of the curve a trade actually lived through.
Do I have to type my trades in?
No. Connect your brokerage and the journal builds itself from your real executions, including trades with multiple legs, adjustments and partial closes. There's no end-of-day homework, which is exactly why it stays complete.
Are commissions included?
Yes. Commissions are recorded per trade from your broker's data, shown as their own column and included in the totals, so net P&L means what it says. Realized P&L and commissions are also carried separately, so nothing is double-counted and nothing is hidden.
What counts as one trade?
A strategy episode: the legs that formed a structure, from its opening fills to the fills that closed it. Scaling out books the closed portion when it happens, and re-entering the same strikes later starts a fresh episode, so each record reflects one decision, not a blur of averages.