Options Strategy Modeler
Build any options structure on a live payoff curve. Drag strikes, flip sides and slice the curve by date, then read profit, loss, breakevens, probability of profit and every greek before you commit a dollar.
A canvas, not an order form.
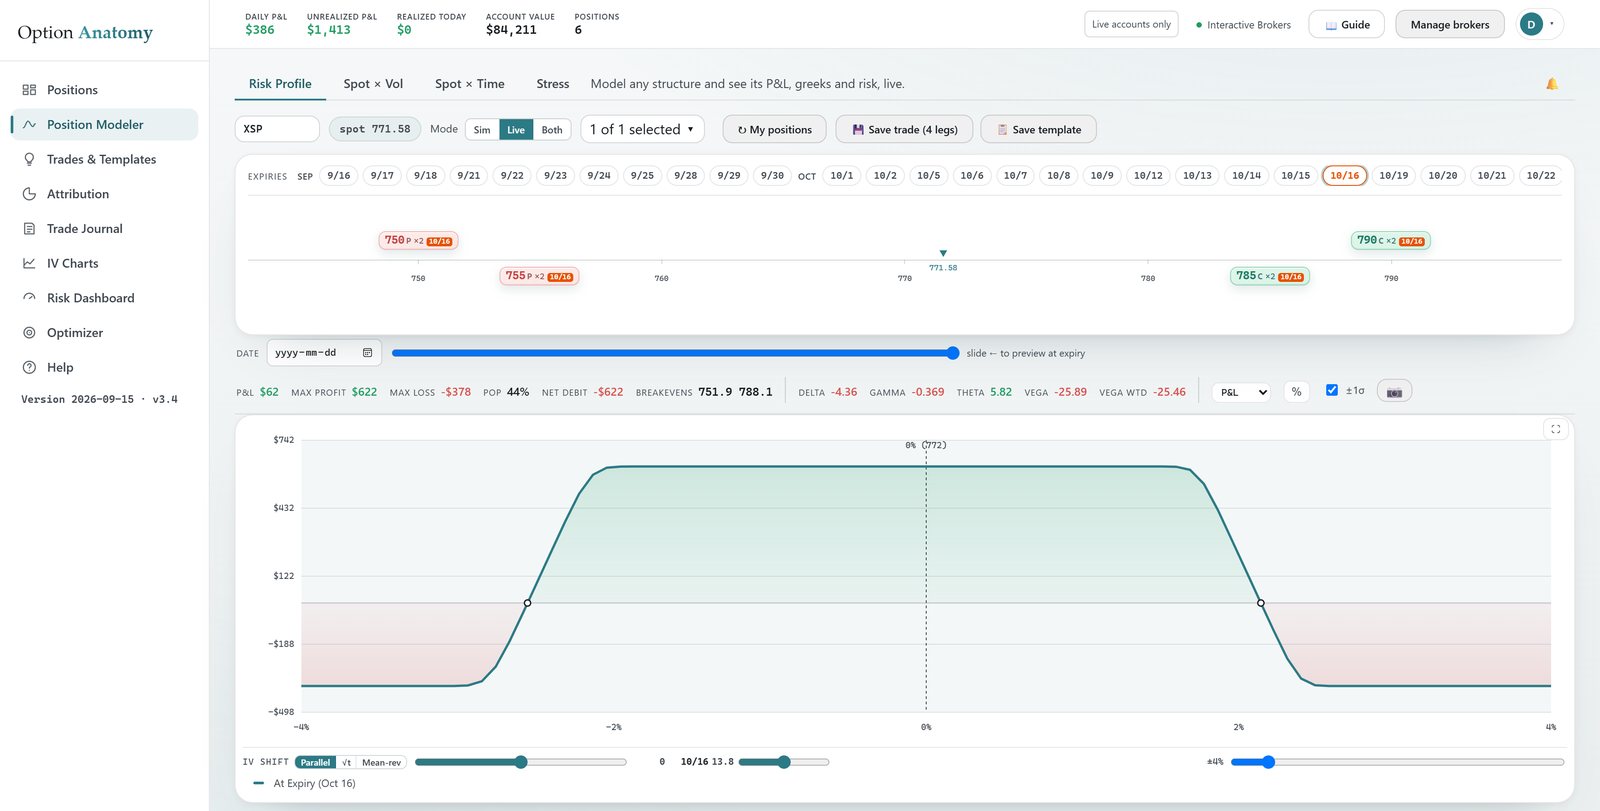
Legs live as chips on a strike ruler, calls green and puts red, longs above the line and shorts below, over the payoff curve they produce. Drag a chip and the whole profile reprices as it moves. Hover for quantity steppers that step through zero, so a short leg flips long instead of vanishing. Click a chip for the full leg card: model price, bid and ask, implied volatility, Delta, Gamma, Theta and Vega, with Mirror, Hide and Remove one click away.
Starting from scratch? Click anywhere on the ruler to drop a leg at that strike, or open the catalog of 58 built-in structures, from long calls through iron condors, calendars, broken-wing butterflies and jade lizards, each with a payoff preview before you place it.
See any date. Not just expiration.
The expiration payoff is the least interesting curve on the chart, because you'll rarely still be holding when it applies. Option Anatomy draws the position as of today, as of any date you slide to, and at expiry, all at once. Scrub the date slider to watch the curve melt toward its final shape, and pin up to eight date slices to compare side by side.
An expected-move band shows where the market itself prices the underlying at each horizon, so you can see at a glance whether your profit zone actually covers the likely outcomes.
Figure: The solid At-Expiry payoff and the dashed today (T+0) curve. The shape you actually trade lives between them.
Priced live. Priced consistently.
Every curve is priced from live quotes and implied volatilities through the app's own pricing engine, the same engine that prices your real positions, so a modeled structure and a held one always speak the same language. It's a complete options P&L calculator underneath: every edit re-solves value, breakevens, maximum profit and loss, probability of profit, net debit and the position greeks in real time.
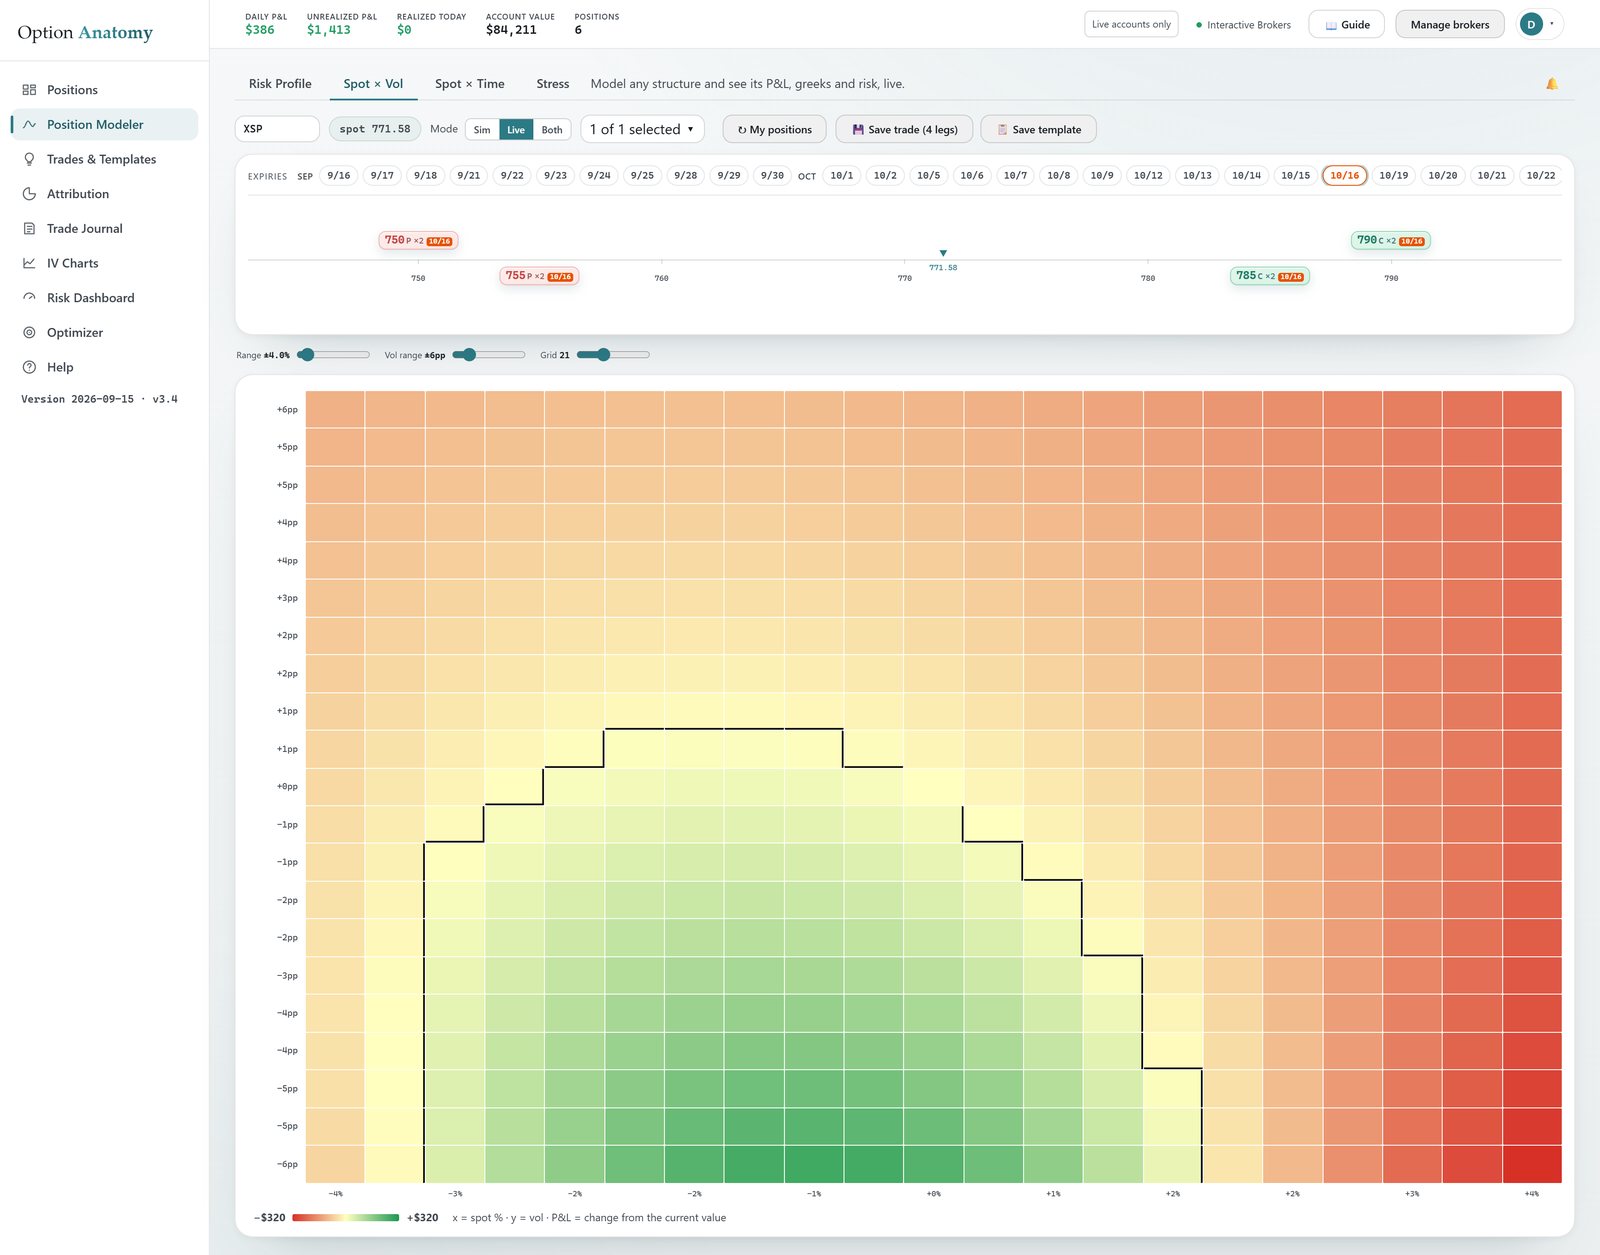
Then stress it. Shift implied volatility across the whole book or per expiration, sweep a Spot × Vol or Spot × Time matrix to see P&L across two dimensions at once, or run the stress table's scenario grid. Switch the chart's metric to draw the curve in Delta, Gamma, Theta or Vega instead of dollars.
Your real book is the starting point.
The modeler isn't only for hypotheticals. Load your held positions, the whole book or any subset, and model on top of them: add a hedge, roll a leg, preview a close. A dimmed base curve keeps the original book in view so every edit shows its consequence against what you actually hold.
Save any setup as a named template and re-apply it onto any later day's chain. Or book a candidate structure as a paper trade at live prices with Save trade and watch, over the following days, what it would have made, with full attribution and no money at risk.
Can a simulated leg affect my brokerage account?
No. Simulated legs exist only inside the modeler, so they are never transmitted to your brokerage, and the app places no orders of any kind. Model as aggressively as you like; your account only changes when you trade it yourself, at your broker.
Which strategies are built in?
58 structures across four tiers: Basic (singles, covered calls, protective puts), Intermediate (verticals, butterflies, iron condors, calendars, diagonals), Advanced (ratio spreads, broken wings, ladders, jade lizards) and Expert (synthetics, combos, strips, straps, guts). Each shows a payoff preview on hover, and every one is fully editable after placing.
Where do the prices and greeks come from?
From the app's own market-data feed and pricing engine: live option quotes and implied volatilities feed a local model, Black-Scholes for European-style options and a binomial tree for American-style, so Delta, Gamma, Theta and Vega are computed the same way for every leg, whether it's simulated or held at your broker.